Tiny Machine Learning and Solving Real-World Problems
This article covers Intelligent Pedestrian Traffic Light Detection (IPTLD) which is a project I created for ESE 3600 - Machine Learning on Embedded Edge Devices at the University of Pennsylvania.
Tiny Machine Learning
Before going into the project I created, it’s important to understand what Tiny ML actually is and how it’s changing the world. Tiny ML is a really new concept running at the intersection between machine learning and embedded systems. It involves deploying machine learning applications on tiny devices like microcontrollers which sometimes have less than 256 kB of RAM and 512 kB of flash memory.
Traditionally, machine learning has been growing with computational power and newer models like OpenAI GPT-3 has over 150 billion parameters. These models are powerful and showcase the true extent of machine learning but because of their sheer size and the amount of power they consume, it is impractial to use them in small day-to-day settings. Tiny ML goes in the opposite direction and relies on some fascinating maths to create the smallest machine learning models possible while maintaining high accuracy. These models can be extremely tiny and take less than 100 kB of RAM meaning that they can be packages into small phone applications, smartwatches, and microcontrollers for small and affordable devices.
Tiny ML uses a lot of novel methods to create really tiny models and I would highly recommend looking into work from Professor Song Han’s group on MCUNet and Pete Warden’s hugely popular work into making Tiny ML accessible here.
Intelligent Pedestrian Traffic Light Detection
Introduction
Knowing when to cross the road can be extremely hard for people with vision impairments. The dangers of not being able to see the pedestrian light properly combined with the sensory overload of the noisy cars around oneself is a deadly combination. Currently in the US, there are over 6000 pedestrian deaths each year and this figure has been rising every year since 2010 which indicates a major threat to vision impaired people and a disparity in the freedoms of those people to walk around without the concern of being struck by a vehicle.
My project attempts to solve this problem using a smartphone, which most vision impaired people have access to, running the edge impulse application to detect whether a pedestrian light is white (indicating that a person can cross the road) or orange (indicating that they should not cross).
Motivation
In many countries like Australia, pedestrian lights have sounds that allow people who cannot see to know when it is safe to cross the road. This exists because crossing the road can be extremely dangerous but is something most people do multiple times daily. In the US, there are no sounds at many traffic lights as regulations passed on accessible pedestrian signals (APS) only apply to newly build infrastructure. This means it can be much harder for people with low visual acuity to know when to cross the road, including at the crossings around the University of Pennsylvania campus. My motivation for this project is to emulate APS without needing to wait for governments in the US to implement this in new infrastructure. It gives people who cannot see more autonomy and allows them to travel much more easily without the reliance on others.
Dataset Information
There are no existing datasets publicly available that contain labelled images of pedestrian crossing lights from the US. Most European and Asian countries have green and red pedestrian crossing lights whereas the US has white and orange ones. Additionally, the shape and graphic of a person vary from the US to other countries. Therefore, it was not possible for me to apply an already existing dataset to this problem and consequently, I had to create my own dataset.
I constructed a dataset using 3 components:
- Manually taking images using my phone around Center City and the University of Pennsylvania campus
- Manually picking images from Google Images that depicted clearly visible pedestrian traffic lights
- Navigating through Google Maps Street View and cropping images at intersections where there were pedestrian traffic lights
Each of these methods were effective, however I realised after data collection with the first 2 methods that any model I trained was extremely inaccurate (~50% which is equivalent to random guessing) because the images were too noisy.
After collecting a huge amount of additional data using the third method, I created 2 separate datasets:
- Images that contained a lot of noise and were minimally cropped
- Images that were cropped to remove most of the noise and contain mostly the pedestrian light with minimal surroundings
These two datasets had the same images but the second one was manually processed to ensure that any other lights or colourful objects in each image was removed and that most of the background was removed from images. This can be seen below, where Figure 1 (left image) is from the first dataset and Figure 2 (right image) is the cropped version of that image included in the second dataset.
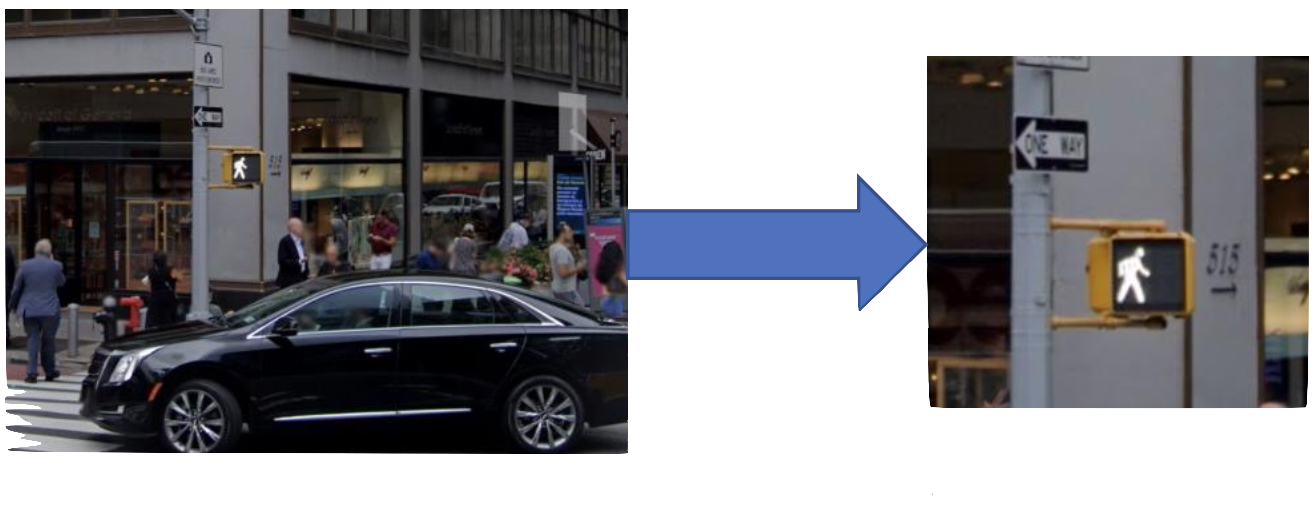
The process of data collection and labelling was extremely time consuming and through this process I came to better understand what we learned about the machine learning pipeline and how time consuming and costly the data collection step can be when there is no existing dataset already available but, in the future, I would like to publicly post my current dataset to give others who want to develop applications around it a good starting point.
Model Design and Explanation
I needed to be able to deploy my application onto a smartphone because the Arduino camera provided had a low field of view and could not detect objects in a specific location several metres away. Additionally, deploying this to phones makes this immediately accessible to people with smartphones without the hurdle of spending money on an entirely new device with the risk of forgetting it at home when a person leaves the house or damaging it from the rain. Deploying this to a phone did create some Tiny ML constraints on the amount of RAM and storage space and added a layer of complexity in terms of deployment. Because of this, I opted to use Edge Impulse to create and train my model.
Edge Impulse is a platform that allows tiny machine learning applications to be made while abstracting the underlying code. It restricts flexibility in terms of deploying the application or combining several different models. When creating this application, I initially used Tensorflow with Transfer learning and then converted it to Tensorflow Lite in order to check for the size and accuracy of the model. However, for the final project deployment, I opted to train the model via Edge Impulse as it offers a quick way to develop tiny visual classification applications on a smartphone.
I created 2 different models, each specific to one of the datasets collected above so that I could determine the effects of the noise in the images and whether we could filter out the noise and get accurate detections using Tiny ML. The biggest challenge was to find which models worked the best and determine what performance metrics were most important to me. What I realised after closely examining the metrics from Edge Impulse and doing some deeper research into my project was that I needed to not only focus on faster inferences with low amounts of RAM usage but also try to minimise the number of false positives, where the program output that a user could cross the road when they could not. This was a much bigger priority than reducing the number of false negatives. If the model determined that it was not safe to cross the road when it was, that would only represent a minor inconvenience and so my biggest focus ahead of overall accuracy was also ensuring that the number of false positives was as low as possible. Edge Impulse provides some flexibility with model choice and after trying different models and examining their confusion matrices, what I found was that certain models had marginally lower performance but had significantly lower false positives.
Looking at Figure 3, it is evident that even though each of the three models shown have similar overall accuracy (84-87%), the leftmost model has about half the number of false positives which makes it significantly safer for users. When training over different datasets, I took this into account and made a trade-off in situations where taking a few percentage points off the accuracy would result in a safer model.
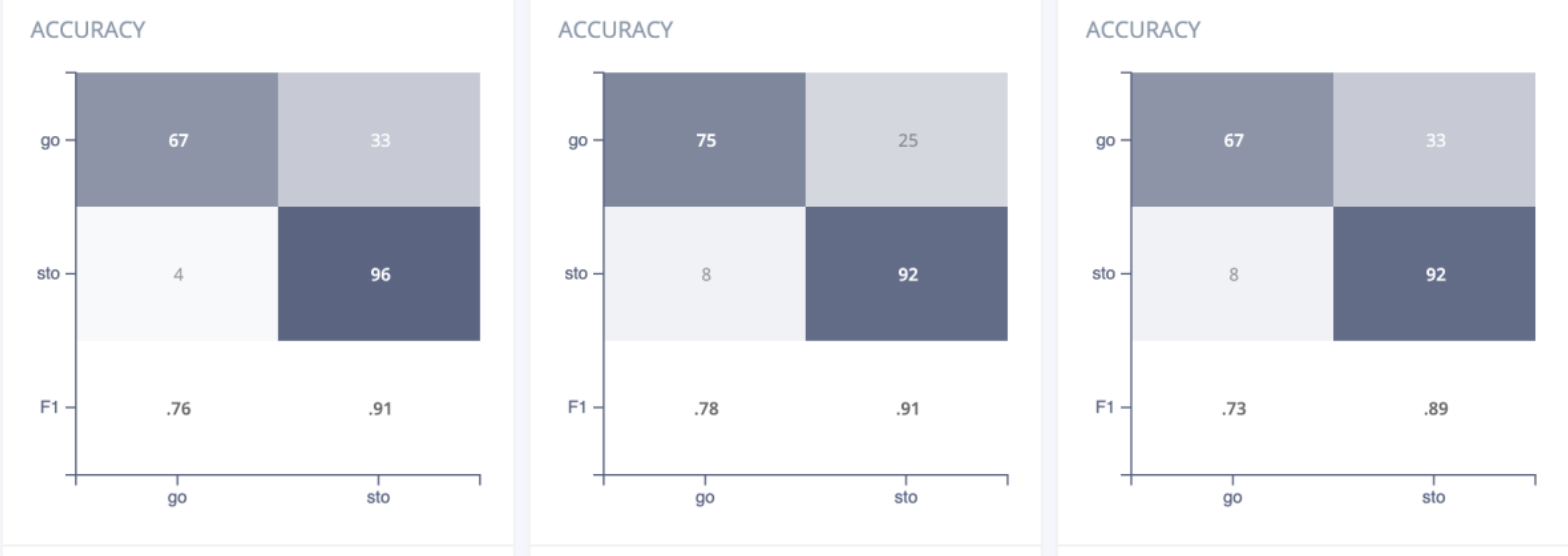 Figure 3: Confusion matrices for three different models with similar accuracy
Accuracy on software
Model 1
After experimenting with different models for the first dataset (noisy images), I determined that the best architecture would be to use transfer learning with MobileNetV2. When I ran this, I wanted to add some more complexity to my model and so, I added 64 neurons as a dense layer and ran the problem again.
This meant that my training loss was reducing a lot, but my validation accuracy started lagging behind it. To make my model more resilient, I added a dropout of 0.5 and noticed that my model was doing significantly better. After training my model, it had a validation accuracy of 86.8% and a false positive rate of 3.8% which meant that in 1 of the 26 validation images that were labelled “stop”, the model
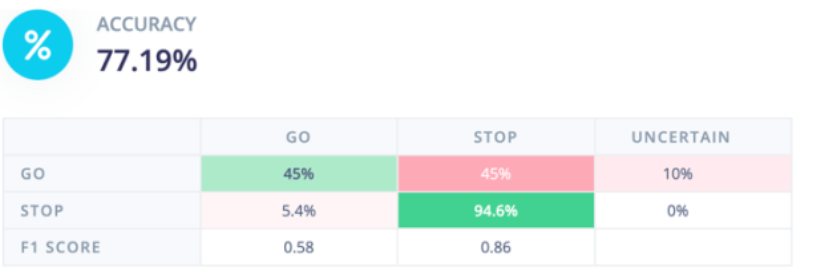 Figure 4: Test Performance for Dataset 1 Model
predicted it to be “go”. Considering the dataset was noisy and many images had other coloured lights and backgrounds in them, this model made safe predictions. The test images performed worse in terms of accuracy but the confusion matrix in Figure 4 shows that the false positive rate is 5.4% which meant that it was performing slightly more dangerously, however, considering that the model only had a few hundred images with noisy data, this was the best performance that could be achieved with the memory and inference time constraints on a project like this. Additionally, the model had a lot of false negatives which did not impact the safety of the model but did make it much less usable as people using the model would be waiting at a traffic light which would continually tell them not to cross. In the future, I would like to improve this model by adding much more data (1000+ images) in different weather and lighting conditions to make the model much more accurate and better at generalising to the many different conditions it would be exposed to in the real world.
Model 2
Model 2 was built on the manually cropped dataset to make each image less noisy. I decided to use transfer learning once again and considered the same factors as with the first model. Looking at the safest and more accurate models, I decided to go with MobileNetV1 as this resulted in the best validation accuracy and lowest number of false positives. This was connected to a layer with 64 neurons and a dropout of 0.1 to improve the resilience of the model. After doing this, I obtained the results in Figure 5 which contains information on the validation set including the accuracy, loss, and confusion matrix. From the confusion matrix, we can see that the model has a similar safety level as the noisy model which was surprising, and I would like to investigate that further in the future. Overall, this model performed much better across all parameters, and this is in line with expectations as the data is much cleaner. This is also in line with the test performance of the model shown in Figure 6. The test accuracy is much higher than Model 1 and the false positive rate is only 3%. Additionally, the false negative rate is much lower which means that the product is more usable as less people would be waiting at a green light. Deployment and Hardware Results
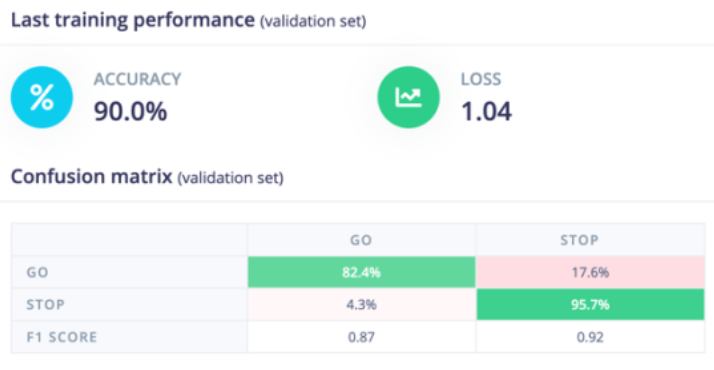 Figure 5: Validation Performance of Dataset 2 Model
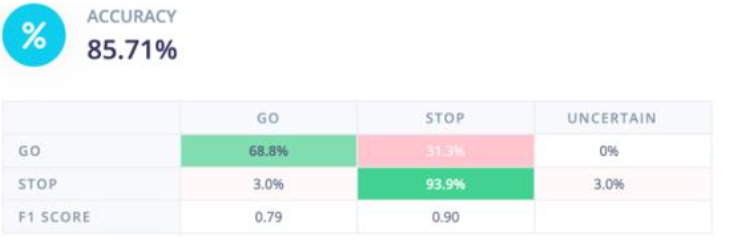 Figure 6: Test Performance of Dataset 2 Model
A video demonstration of the deployment can be viewed at https://www.youtube.com/watch?v=e5NfGWAu06Q. Deployment was simple as the model was developed on Edge Impulse which has various quick and easy ways to deploy machine learning models as web applications on smartphones. I used the standard method of inference that they packaged the application into. Although this did not give much room for modification, it allowed me to quickly deploy various models and verify that the one with the highest testing accuracy on software played out the same way on the hardware itself.
After deploying both above models onto my phone, I confirmed that the second model was much better at a shorter distance for accurate detections, however it worked better during the night as the traffic lights were much brighter with respect to the surroundings. During the day and at greater distances, the first model performed better but I decided not to use this as both models were only ~70% accurate when deployed during the daytime. I think this could be fixed in the future by sharpening the images. After sunset, the second model had extremely good predictions and would even filter out the unwanted background streetlights and traffic lights. This can be seen on a working deployment in Figure 7 (on the right) which shows the correct classification and classifications score below that.
From the software and hardware results, it is evident that the second model learned much better than the first model which was expected since the training images fed into it were better processed to focus on the pedestrian lights. Unfortunately, this meant that although the accuracy of predictions excelled with low background noise, the first model was much better during the day when lights were not as bright, and it was less apparent what the streetlight displayed. Because of this, I would like to experiment more in the future and collect a bigger dataset so that the second model becomes more resilient and works with a higher degree of accuracy during the day. Additionally, I would like to try mixing the datasets together and training the model on the entire ensuite of data to test whether that helps it filter noise and make better predictions. I will conduct these experiments during the summer and release a public copy of the dataset I use once it is completed.
Additional Customisations
One of the biggest customisations I briefly mentioned in the accuracy on software section above was erring on the side of caution with predictions. This was done by choosing a model architecture that prioritised safer predictions (less predictions of “GO” when the light actually says “STOP”) over reductions in overall accuracy. Although this was only a theoretical concept when I was experimenting on software, once I deployed the model, I truly saw the importance of this customisation play out. Whenever the camera was too far from the traffic light and could not make out the sign properly, it always predicted “STOP”. This meant that in no instances of actual testing with multiple traffic lights did the model tell me to cross the road when I was not supposed to. This came with the small disadvantage that at times, the model would be uncertain or predict “STOP” when the light said “GO” but this only happened a few times and would not have the possibility of directly endangering someone.
I would like to create an integrated application in the future that can be deployed onto smartphones and have non-visual forms of labelling such as by using vibration to let a visually impaired person know when it is time to cross the road rather than simply display it with letters as in the Edge Impulse deployment. This would require a lot of additional code but has major potential in the realm of increasing accessibility to the visually impaired in the United States.
Conclusion
Crossing the road can be an extremely dangerous task for those who are blind or visually impaired. This project “Intelligent Pedestrian Traffic Light Detection” improves accessibility by using machine learning on the Edge Impulse platform to detect whether a pedestrian light says “STOP” or “GO”. By testing and trialling several different transfer learning models, this model was constructed to be highly accurate and err on the side of caution with its predictions in unclear situations to ensure the safety of pedestrians. Additionally, it provides intriguing insight into the use of Google Maps Street View for data collection and demonstrates the advantages and trade-offs of using noisy images against manually cropped ones in the training of Tiny ML models and revealing how powerful tiny models truly can be in solving critical real-world problems on hardware that the majority of people on the planet already use every day.
You can find the dataset used here :)
Comments